Data Visualiser
Along with the software written to go on the microcontroller we have written some software to visualise the data coming back to the base station from the microcontroller.
The data visualiser has a map, compass, and a few other data displays.
Map
The map will display an area around the balloon payload based on the coordinates provided by the GPS module on the payload. the map images are gathered from Google, using URL image capturing, this essentially means the program will convert the coordinates from the balloon into Google Maps coordinates, create a URL and copy the image from that URL.
 Compass
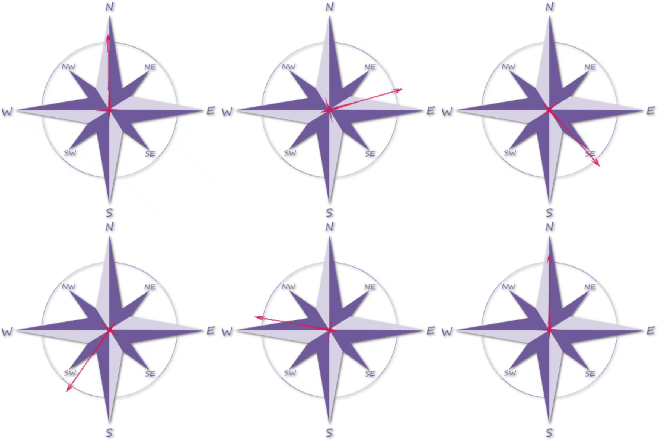
Magnetometer data is fed into the visualiser from the balloon and is superimposed onto a representation of a compass. This data will provide us with a rough idea of which way the payload is facing. We can’t get a perfect direction due to the fact that magnets and the magnetic fields of the Earth, but even if it isn’t perfect, it still provides us with an idea and looks pretty.
Cube 
The visualiser has a 3D cube in next to the Compass and this represents the payload. The cube is able to rotate, flip, mimicking the behaviour of the balloon payload.
Numerical Data
Along with all of the visual interpreted data there is a live data output. all of the data displayed in this section comes directly from the senors. The data includes measurements from the 9DOF and barometer and also has the GPS coordinates. Once all of these values are received they are converted into understandable number – including G’s, metres, and degrees Celsius – if the values aren’t already understandable.
Modes
The last function the visualiser has is the ability to display data from a saved file or live from a COM port. To read from the serial port the program accesses the ports through the Serial library. the serial library allows python to read, write and manipulate data coming in and out of the COM ports. The other method of displaying data is to come from a file. The only files the visualiser reads are .csv or comma separated values. the reason for this is because of how easily the values are to be read. each value for one frame will be on one line and every components output will be one value in that line.
So all together the visualiser ill look like the image below. It is still in development and has a lot of tweaks to be made, but it is getting there and should have enough functionality for it to be useful during our balloon launch and afterwards during data analysis.

